
Welcome to Global Data Center Hub. Join investors, operators, and innovators reading to stay ahead of the latest trends in the data center sector in developed and emerging markets globally.
Table of Contents
Executive Summary
The Size and Shape of the US Data Center Market
The Operator Layer
Demand Is Not the Problem
Money Is Not the Problem
Power Delivery Is the Gate
PJM’s Auctions Price the Shortage
The Utility Layer
The Neocloud Layer
Recommendations
Executive Summary
One thing decides how fast US data centers grow in 2026.
It is the ability to get electric power delivered to the site not money, land, chips, or demand.
Two gates control power delivery.
The first is the interconnection queue. This is the waiting line a project joins to get permission to plug into the electric grid.
The second is the equipment supply chain. Transformers and switchgear are the machines that take high-voltage grid power and convert it into power a data center can use. Both gates are jammed.
The numbers show how jammed. Goldman Sachs Research (2026) estimates only 60% of next year's scheduled capacity will arrive on time, dropping to 50% over the following two years.
Bloomberg, citing Sightline Climate (May 2026), estimates 30–50% of the roughly 16 GW planned for 2026 will be delayed or canceled due to power availability, equipment shortages, and community opposition.
The constraint looks different in each market. Northern Virginia faces grid and transmission delays, Texas new curtailment rules, Phoenix power shortages, and Santa Clara transmission limits.
Nationally, large power transformers average 128-week lead times, while generator step-up units take 144 weeks (Wood Mackenzie, Q2 2025).
Money and demand prove the point from the other side.
The five largest hyperscalers plan roughly $602 billion in 2026 capital spending, with about 75% tied to AI (CreditSights, January 2026).
Vacancy across primary U.S. markets is a record-low 1.4%, and 81.5% of capacity under construction is already leased (CBRE, H2 2025).
The buyers are waiting. The capital is waiting. The power is not there.
One common read needs correction. The constraint is not regional. The way it shows up is regional.
The cause is national, running through the grid queue and transformer supply.
1. The Size and Shape of the US Market
The National Totals
The US market can be counted three ways.
By facilities: 17.2 gigawatts of active IT load across 2,396 data centers (ABI Research, 2025).
By revenue: a $72.37 billion colocation market led by Equinix and Digital Realty (United States Data Center Colocation Databook, 2026).
By electricity: data centers consumed 176 terawatt-hours in 2023 (4.4% of U.S. electricity), with LBNL projecting 325–580 terawatt-hours by 2028 and EPRI estimating 9–17% of U.S. electricity demand by 2030.
One Country, Many Markets
The US is not one market in any useful investment sense.
It is a collection of distinct grid regimes, utility tariffs, transmission constraints, and planning processes.
PJM, ERCOT, and CAISO each have different interconnection rules, while utilities such as Dominion, Oncor, APS, Georgia Power, and AEP Ohio set their own terms for large loads.
Where a project sits in this system determines how quickly it gets power, what it pays, and the obligations it carries.
Concentration at the Top
The market is heavily concentrated. Northern Virginia alone has 4,039.6 megawatts of colocation inventory, about 43% of the 9,432-megawatt U.S. primary-market total (CBRE, H2 2025).
Loudoun County, its core, has 200 operating data centers and 117 more in development (October 2025).
Operator concentration is similar: Digital Realty holds the largest U.S. leased data center power share at 15%, followed by Equinix at 4.9% (Q4 2024).
The Hub Map
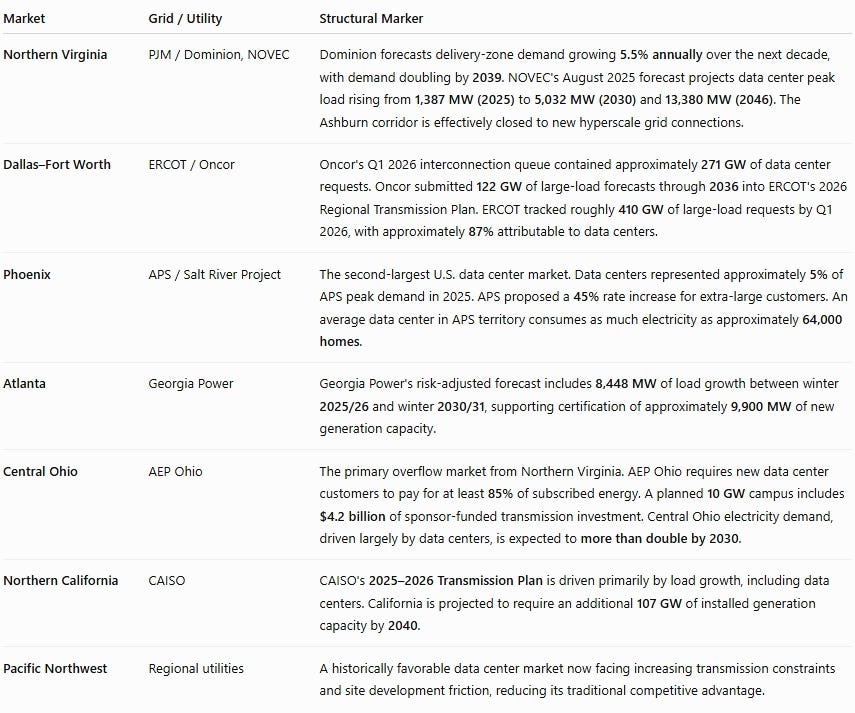
The build-out runs through a small set of hubs, each defined by its grid and its utility.
The table below compiles the structural marker for each hub from utility and grid disclosures.
2. The Operator Layer
The table below ranks the top 25 US operators by operational IT capacity in 2025.
These are operational figures. Announced pipelines are far larger, and the notes beneath the table cover the gap.
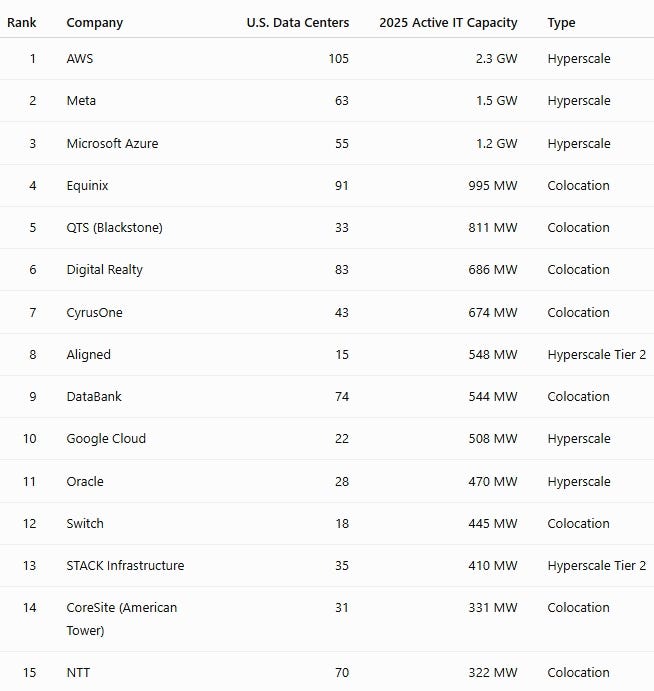
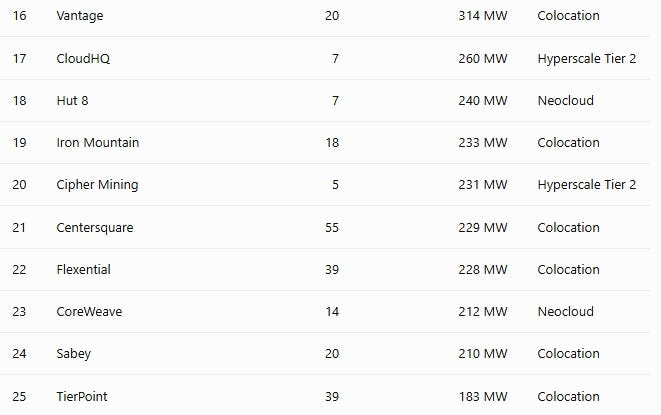
Source: ABI Research, “Top 25 Largest Data Center Companies in the U.S. by Active IT Capacity,” February 25, 2026. Total US active IT load: 17.2 gigawatts across 2,396 data centers.
Three notes on reading the table.
First, ABI’s hyperscaler megawatt figures appear conservative relative to capex and build activity.
ABI itself reports AWS added about 3.8 gigawatts of capacity in 2025.
Second, operational figures and announced pipelines are different things.
CloudHQ’s Ashburn LC campus is planned for more than 1.7 gigawatts at full build-out. STACK is launching a 1-gigawatt Virginia campus.
CyrusOne is building a 760-megawatt Texas campus. DataBank is developing a 480-megawatt campus in Red Oak, Texas, and a 192-megawatt campus in Culpeper, Virginia.
Third, methodology varies by tracker. CBRE’s H2 2025 market data, which counts colocation operating inventory, puts Northern Virginia alone at 4,039.6 megawatts, about 43 percent of the 9,432-megawatt US primary-market total.
3. Demand Is Not the Problem
The Forecasts Point One Direction
The demand estimates vary by source, and all of them are estimates built on utility and grid forecasts that the forecasters themselves flag as uncertain.
LBNL estimates data centers used 176 terawatt-hours in 2023 (4.4% of U.S. electricity), rising to 325–580 terawatt-hours (6.7–12%) by 2028.
Grid Strategies (December 2025) projects the five-year U.S. peak-load forecast reaching 166 gigawatts by 2030, with about 90 gigawatts driven by data centers.
S&P Global likewise projects data center electricity load more than doubling from 61.8 gigawatts in 2025 to 134.4 gigawatts by 2030.
The Market Data Confirms It
Vacancy tells the cleaner story. Primary-market vacancy fell to a record low of 1.4% at year-end 2025, even as supply grew 36% to 9,432 megawatts.
Net absorption reached a record 2,497.6 megawatts, with Northern Virginia accounting for 1,102 megawatts, while 81.5% of capacity under construction was already pre-leased (CBRE, H2 2025).
A 1.4% vacancy rate is what a supply squeeze looks like from the demand side.
We examined the supply side of the same squeeze in Land Is the New Bottleneck.
Under-construction capacity fell for the first time since 2020 from 6,350 to 5,994 megawatts not because demand weakened, but because permitting, zoning, and power-procurement delays slowed new development.
4. Money Is Not the Problem
The five largest hyperscalers reached about $602 billions of planned capital spending for 2026, up 36 percent year over year, with about 75 percent, roughly $450 billion, tied to AI (CreditSights, January 2026).
The Big Four alone guided up to $630 billion for 2026, about 62% above the record $388 billion spent in 2025, led by Amazon, Google, Meta, and Microsoft.
The longer arc is larger. Goldman Sachs Research (June 2026) projects Meta, Microsoft, Amazon, and Alphabet will spend a combined $5.3 trillion from 2025 to 2030, up from its previous $4.5 trillion forecast.
Private capital matches the corporate wall of money. Infrastructure funds held more than $1.7 trillion in assets, including about $400 billion in dry powder as of September 2025 (Goldman Sachs).
The roughly $40 billion Aligned acquisition by BlackRock, Nvidia, and Microsoft underscores strong exit liquidity, while project finance, private credit, and asset-backed securities remain widely available.
Capital is chasing power. Power is not chasing capital.
5. Power Delivery Is the Gate
The Queue Is Measured in Years
The federal target for signing an interconnection agreement is 8 to 11 months. The actual national average wait is about 25 months.
In ERCOT, the Texas grid, it is about 20 months. In PJM, the grid serving the mid-Atlantic, it is about 40 months (Carbon Direct, “AI Meets the Grid,” May 14, 2026).
Those are averages. In the zones where data centers are actually growing, active projects wait 36 to 48 months in both PJM and ERCOT.
In Northern Virginia, Phoenix, and Dallas, grid interconnection waits run 4 to 7 years (Sightline Climate via Bloomberg, May 2026).
The national queue is enormous. LBNL’s “Queued Up: 2026 Edition,” with data through the end of 2025, counts about 2,060 gigawatts of generation and storage actively seeking interconnection.
For projects built in 2025, the median time from request to commercial operation exceeded 5 years.
The Transformer Is the Deeper Gate
Even a project with a grid connection cannot energize without equipment.
Wood Mackenzie’s Q2 2025 survey found standard power transformers average 128-week lead times, while generator step-up transformers take 144 weeks.
Some specialized units now require up to four years, and substation transformer lead times have exceeded 160 weeks.
Prices moved with the wait times. Since 2019, power transformer prices have risen 77% and generator step-up transformer prices 45%, with some distribution transformers up as much as 95% (Wood Mackenzie, August 2025).
Demand has surged alongside prices, with power transformer demand up 119% and generator step-up demand up 274%.
The equipment market itself is scaling to meet the build.
Wood Mackenzie projects the U.S. data center electrical equipment market growing from about $20 billion in 2026 to $65 billion by 2030 as data center capacity expands from roughly 24 gigawatts to 100 gigawatts.
The Gate Has Moved
In 2023 and 2024, the gate was chips and capital. In 2025 and 2026, the gate is power delivery and electrical equipment.
This is the thesis we laid out in Power Is the Moat: power availability not land, not fiber, not capital is the gating factor for AI infrastructure. The mid-2026 data confirms it.
Bloomberg’s April 2026 reporting frames the binding constraint as physical infrastructure.
Transformers, switchgear, and batteries, much of it dependent on Chinese supply, now set the timeline.
One industry source put it plainly: “When equipment availability becomes the gating factor instead of capital or permitting, your entire expansion timeline gets dictated by supply chains you can’t control” (via IndustrialSage).
6. PJM’s Auctions Price the Shortage
A capacity auction is the market where a grid operator buys promises of future power supply.
When the clearing price spikes, supply is scarce. PJM’s auctions now read as a scarcity alarm.
The clearing price climbed from $28.92 per megawatt-day for the 2024/25 year to $269.92 for 2025/26, then $329.17 for 2026/27, then $333.44 for 2027/28 (PJM, Utility Dive).
The last three auctions all cleared at the FERC-approved price cap. The 2025/26 jump alone was an 833 percent single-year increase.
Data centers drove the move. Monitoring Analytics (January 2026) found that data centers caused 63 percent of the 2025/26 price increase, about $9.3 billion in added costs, and accounted for 40 percent of 2027/28 auction costs, $6.5 billion of $16.4 billion.
The December 17, 2025, auction for 2027/28 crossed a line.
For the first time, the entire regional grid fell short of its reliability requirement, by about 6,625 megawatts.
The Dominion and BGE zones cleared at premiums of $444.26 and $466.35 per megawatt-day in 2025/26.
Without the price cap agreed with Pennsylvania, PJM estimates the 2027/28 price would have reached about $530 per megawatt-day, roughly 60 percent higher.
7. The Utility Layer
Dominion and PJM: The Queue Plus Transmission Case
Dominion Energy in Virginia holds about 40 gigawatts of data center capacity under contract and about 70,000 megawatts of data center interconnection requests in queue.
The queue is nearly three times the system’s peak load, growing by about 10 requests per month, though Dominion expects about 25,000 megawatts to connect by 2031.
PJM projects the Dominion zone as its fastest-growing region, with the proposed 525 kV transmission line adding 3–4 gigawatts no earlier than 2029–2032.
Meanwhile, Virginia’s SCC is reviewing the large-load interconnection process.
Across PJM, the timeline from interconnection application to commercial operation now exceeds 8 years, versus under 2 years in 2008 (RMI).
Since 2023, PJM has processed more than 170,000 megawatts of generation requests, with about 30,000 megawatts remaining in the 2026 transition queue.
New programs such as Bring Your Own New Generation and Non-Capacity-Backed Load allow faster interconnection in exchange for curtailment risk, while developers on the expedited track pay 100% of network-upgrade costs.
ERCOT: Speed With a New Catch
Texas holds more than 233 gigawatts of large-load interconnection requests as of December 2025, more than 70 percent of them data centers, up about 300 percent in a year.
In Q1 2026 alone, another 198 gigawatts of large-load requests were submitted roughly equal to ERCOT’s entire peak load while the generation queue reached 421–432 gigawatts, about 77% from solar and storage.
SB 6, signed June 20, 2025, changes the rules.
It classifies large loads as 75 megawatts or more, imposes a minimum $100,000 study fee, requires curtailment protocols for new large loads, and allows ERCOT to dispatch on-site generation during emergencies.
Texas still offers fast grid connections, but that advantage comes with greater curtailment risk, while Oncor’s proposed 765 kV transmission line is not expected until around late 2028.
Georgia Power: New Generation, New Guardrails
Georgia Power projects about 8,500 megawatts of load growth over six years.
The Georgia PSC approved 9,885 megawatts of new generation in December 2025, with about 80% supporting data centers at an estimated lifetime cost of $50–60 billion.
Large-load customers above 100 megawatts face minimum billing and longer contracts, while Georgia Power will backstop costs through 2031 if demand falls short.
At the same time, local development moratoriums are expanding, including around the Atlanta BeltLine, MARTA buffers, Fayetteville, and Camden County.
Phoenix: Power, Not Water
Phoenix is the number two US market, with about 1,380 megawatts commissioned and more than 100 area data centers drawing about 1.4 gigawatts.
Water is a real but secondary constraint.
Phoenix holds a state-verified 100-year water-supply certification, and operators increasingly deploy closed-loop and air cooling, including Aligned’s Delta3 arrays and Meta’s reuse projects.
Power and transmission are the tighter near-term gate, running through new APS 230 kV lines and Salt River Project capacity.
The common assumption that water gates Phoenix is wrong.
Santa Clara: The Hard Limit
Silicon Valley Power in Santa Clara is the clearest hard-limit case in the country.
Digital Realty’s SJC37, built for 48 megawatts, and Stack’s SVY02A, at 48 megawatts, sit fully built but unpowered.
Nearly 100 megawatts of finished capacity waits on a $450 million system upgrade due in 2028.
Digital Realty’s site obtained planning permission in 2019 and remains unenergized six years later.
The city has 57 active or under-construction data centers.
Operators are working around the ceiling with on-site generation, including ECL’s 35-megawatt FlexGrid facility using grid, gas, and hydrogen fuel cells, and flexibility pilots run by SVP and Emerald AI.
8. The Neocloud Layer
A neocloud is a company that rents out GPU computing power built for AI workloads.
Most now report contracted or active power in megawatts and gigawatts instead of GPU counts, as Blackwell systems make GPU totals less meaningful.
Two distinctions matter: company-disclosed versus third-party estimates and contracted versus deployed capacity.
CoreWeave (public, CRWV) disclosed about 250,000 GPUs across 32 data centers and 360 megawatts active as of December 31, 2024, in its S-1.
It now reports 43 active data centers, more than 850 megawatts active, and over 3.1 gigawatts contracted at end-2025.
Revenue exceeded $5.1 billion with a $66.8 billion backlog, targeting 1.7 gigawatts active by end-2026 and 5 gigawatts by 2030. Microsoft accounted for 62–67% of revenue.
Crusoe (private) reports power. Its Abilene, Texas campus (Stargate Site 1) spans 1.2 gigawatts, expanding to roughly 2.1 gigawatts with a new Microsoft campus. Oracle expects the site to eventually host more than 450,000 GB200 GPUs.
Nebius (public, NBIS) reports megawatts and annual recurring revenue. It targets 800 megawatts to 1 gigawatt connected and 2.5 gigawatts contracted by end-2026.
U.S. expansion includes Kansas City and New Jersey, supported by major Microsoft and Meta contracts.
Lambda (private) runs roughly 15 to 20 US data centers with more than 320 megawatts committed, and targets 3 gigawatts by 2030 and more than 1 million NVIDIA GPUs long term.
Its Kansas City site hosts more than 10,000 Blackwell Ultra GPUs, and it signed a multi-billion-dollar Microsoft agreement in late 2025.
Voltage Park (private) built about 24,000 H100 SXM5 in 2023 for roughly $500 million and now runs about 35,000 to 36,000 GPUs across six U.S. facilities, with about 60 megawatts active following its January 2026 merger with Lightning AI.
Together AI (private) runs an aggregation model on partner infrastructure. It deployed a 36,000-GB200 cluster in 2025 and has secured access to more than 100,000 GPUs, though much of that capacity is leased rather than owned.
IREN (public, IREN) gives the most granular disclosure: about 23,000 GPUs as of September 2025 across multiple NVIDIA and AMD platforms.
It operates six data centers with 2,910 megawatts of grid-connected capacity and targets $4.4 billion in annual recurring revenue.
Vultr (private) runs 32 global locations, not US-only, offering NVIDIA and AMD AI platforms, with a $3.5 billion valuation established in 2024.
Nscale (Europe-headquartered with US operations) has about 200,000 GB300 contracted with Microsoft across Europe and the US as of October 2025.
The figure reflects contracted capacity, not deployed hardware.
9. Recommendations
Underwrite to the power-delivery date, not the construction date.
The gating variable is utility energization plus transformer delivery, not building shell completion.
For any US site, demand documented evidence of three things before crediting a delivery timeline: an executed or secured interconnection position, transformer and switchgear order slots with an assumed 24-to-48-month lead, and allocated substation capacity.
Treat announced pipeline as optionality, not supply. Only about one-third of 2026-announced capacity was under active construction as of mid-2026.
Prefer markets and structures that bypass the queue.
ERCOT retains a genuine speed-to-power edge, now tempered by SB 6 curtailment exposure.
Behind-the-meter and on-site generation, along with PJM’s Bring Your Own New Generation track, offer routes around the interconnection queue.
Secondary markets with spare substation capacity de-risk timelines. Discount saturated grids.
Northern Virginia is transmission-constrained until roughly 2029 to 2032, and Santa Clara until 2028.
Monitor four thresholds as constraint-shift signals.
First, large power transformer lead times need to fall below roughly 80 weeks from today’s 128.
Second, PJM capacity prices dropping below about $300 per megawatt-day would signal improving supply.
Third, interconnection reforms must shorten the current 3–4 year data center wait, with PJM’s new process and ERCOT’s SB 6 rules rolling out in 2026.
Fourth, a cut in hyperscaler capex guidance would indicate demand not power is finally easing.
Until at least two of these change, power delivery remains the binding constraint.
Underwrite counterparty bifurcation in the neocloud layer.
Hyperscalers and CoreWeave carry durable balance sheets and long-dated contracts.
Smaller neoclouds carry customer-concentration risk and GPU-depreciation risk, since a GPU financed over 5 to 6 years can sit against contracts that run shorter.
Always separate contracted power from deployed GPUs. The two diverge widely.
Nscale’s 200,000 GB300 is contracted, not live. CoreWeave’s 3.1 gigawatts contracted stands against 850 megawatts active.
"By facilities: 17.2 gigawatts of active IT load across 2,396 data centers (ABI Research, 2025)."
What is the definition of IT load? Is it different than AI data center load? I'm trying to differentiate between AI load and other data center load.