
Open Compute Project: The Hardware Moat Facebook Built and Gave Away
OCP's Strategic Logic, Enterprise Hardware Commoditization, The Design Efficiency Gap, What Hyperscale Moats Actually Look Like

Welcome to Global Data Center Hub. Join investors, operators, and innovators reading to stay ahead of the latest trends in the data center sector in developed and emerging markets globally.
Facebook’s infrastructure was breaking under its own weight in 2009. The company had scaled to 300 million users. The servers were the problem.
Frank Frankovsky, Facebook’s director of hardware design, flew his team to Prineville, Oregon that spring to evaluate a site for the company’s first purpose-built data center. What the team found was a cost structure that had become untenable at scale.
HP and Dell built servers for enterprise buyers running mixed workloads across heterogeneous environments. Facebook ran one workload at massive and growing scale.
The enterprise servers carried dual power supplies, hot-swap drive bays, and management controllers Facebook had no use for. At 100,000 servers, the unnecessary component cost was significant. At one million, it was structural.
Frankovsky’s team designed a server from scratch.
Every redundant component removed.
Every unnecessary watt eliminated.
The targets: a 38% reduction in energy consumption and a 24% reduction in capital cost per unit of compute.
They hit both.
What the Cloud Era Had Produced
Why AWS EC2 Rewrote the Economics of Compute Ownership established the transfer: EC2 moved factory ownership from tens of thousands of enterprises to a small number of hyperscale operators. By 2009, that consolidation had produced a second-order problem.
Amazon, Google, and Facebook were buying hardware from vendors engineered for the enterprise market.
Enterprise hardware optimizes for redundancy, interoperability, and generalist application across a wide customer base. Hyperscale operators run a single workload across a homogeneous environment at hundreds of thousands of units.
The mismatch produced vendor pricing power the hyperscalers’ purchasing volume should have eliminated. Every unnecessary component compounded across every server.
Every redundant watt compounded across every refresh cycle. The hyperscale operators were funding vendor margins on components they had no use for.
Frankovsky’s team in Prineville had located the inefficiency precisely. The question was what to do with it.
The Strategic Decision
Facebook published its server and rack designs in April 2011 through the Open Compute Project. The announcement positioned OCP as an open-source community initiative. The strategic logic ran deeper.
Publishing the designs commoditized the hardware layer below the operator.
Any manufacturer worldwide could build to the OCP specification. Vendor margins on enterprise-grade hardware lost their justification against a published open alternative.
Facebook captured none of the manufacturing economics and all of the purchasing benefit.
The moat was the engineering knowledge required to operate at the efficiency the design enabled.
That knowledge took years to accumulate. It does not transfer with a published specification.
The Factory Acquires a New Variable
IBM Built the Factory. The Market Built a Different One. established the frame: factory ownership determines where returns accumulate.
Why AWS EC2 Rewrote the Economics of Compute Ownership identified the first ownership transfer from the enterprise to the hyperscale operator.
OCP introduced a third variable the ownership frame alone cannot capture.
Two facilities running identical workloads at identical occupancy rates produce different returns when one was engineered at the component level for that workload and the other was assembled from enterprise hardware at standard vendor margins.
The capacity reads the same in a headline megawatt figure. The economics are categorically different.
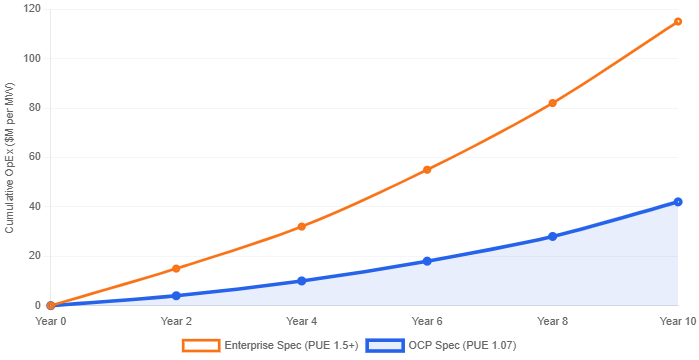
Facebook’s Prineville facility achieved a PUE of 1.07 at launch. The industry average exceeded 1.5.
Seven cents of overhead for every dollar of compute energy consumed, against more than fifty cents for the typical operator. That gap compounds at every scale point and every refresh cycle.
You should hold one fact when evaluating any data center asset today. A design efficiency gap is structural. It lives in the component specification, the rack architecture, and the power distribution design variables set at construction, not at management. Operational improvement cannot close it.
What OCP Did to the Vendor Landscape
Dell and HP joined the Open Compute Project within two years of its founding. The alternative was losing hyperscale purchasing volume to manufacturers building to the open specification at lower margin.
Two asset classes emerged from a market that had previously appeared homogeneous.
Hyperscale-designed facilities engineering at OCP-grade efficiency on one side. Enterprise-designed facilities at standard vendor specifications on the other. Both were being underwritten at broadly similar metrics.
Standard data center due diligence frameworks measured raised floor space, power capacity, and lease terms.
PUE, rack density, cooling architecture, and power distribution design were footnotes. The variables separating the asset classes were the variables the frameworks were least equipped to measure.
When you underwrite a data center asset today, the hardware architecture is the primary determinant of operating cost at scale.
A facility built to enterprise specifications cannot compete on unit economics with a facility engineered from the component level for the workload it runs.
That distinction does not appear in a headline megawatt figure.
Three Positions on the Design Moat
For independent operators building new capacity in the early 2010s, OCP created an adoption decision with a long compounding tail.
Operators who adopted the open specification early accumulated design experience and supply chain relationships that deepened with each hardware generation.
Operators who continued building to enterprise specifications preserved vendor relationships at the cost of structural disadvantage against hyperscale-aligned competitors.
The binding constraint shifted from capital access to engineering depth and engineering depth takes years to build.
For infrastructure investors evaluating operating assets, OCP introduced a diagnostic variable that standard due diligence frameworks were not capturing.
Metrics such as PUE, server density per rack, cooling architecture, and power distribution design help distinguish genuinely efficient assets from those that appear equivalent at a headline level.
The facilities that successfully made the OCP transition achieved higher operating margins on the same revenue per megawatt. Those that had not were carrying a structural cost disadvantage that their financial statements had not yet fully reflected.
For public equity investors tracking the hyperscale operators, OCP’s publication was the moment hardware efficiency became defensible at scale.
The open design commoditized the entry point. The operational expertise required to extract maximum efficiency from it continued compounding independently inside each operator.
The Design Gap Holds
Facebook’s Prineville facility opened in April 2011. The PUE of 1.07 was an operating result benchmarked against an industry standard nearly 40% higher.
Fourteen years later, the design gap has widened.
Each generation of AI workload denser GPU configurations, higher power draw per rack, more demanding thermal management compounds the advantage of operators who have been engineering at the component level for a specific workload since 2011.
The operators who built that capability early are running the facilities qualifying for the most demanding AI infrastructure specifications today.
The ones who did not are running the retrofit numbers. Those numbers, in most cases, do not work. That story a modern, well-maintained facility discovering it cannot economically serve the workload driving the market is where this series goes next.