
Welcome to Global Data Center Hub. Join investors, operators, and innovators reading to stay ahead of the latest trends in the data center sector in developed and emerging markets globally.
For two years, the AI infrastructure question was whether the largest cloud companies would spend enough. That question is settled.
The one that replaced it is harder: can the hardware arrive, get switched on, and start earning before the bills for it come due?
Microsoft’s September quarter is the clearest test of that question so far.
Third-party GPU capacity Microsoft had contracted for slipped out of the quarter. On the old reading, that should have capped Azure. It didn’t.
Azure grew 48%, beat expectations, and management guided the December quarter to 49% to 50% growth in constant currency, against a 45.1% consensus.
The easy read is that Microsoft found a cheaper way to grow. Part of that is true. Most of it is a delay. The spending did not disappear; it moved into the next two quarters.
And the cash the buildout ties up now sits in places the capex line does not show.
The Capex Shortfall Was a Delivery Shortfall
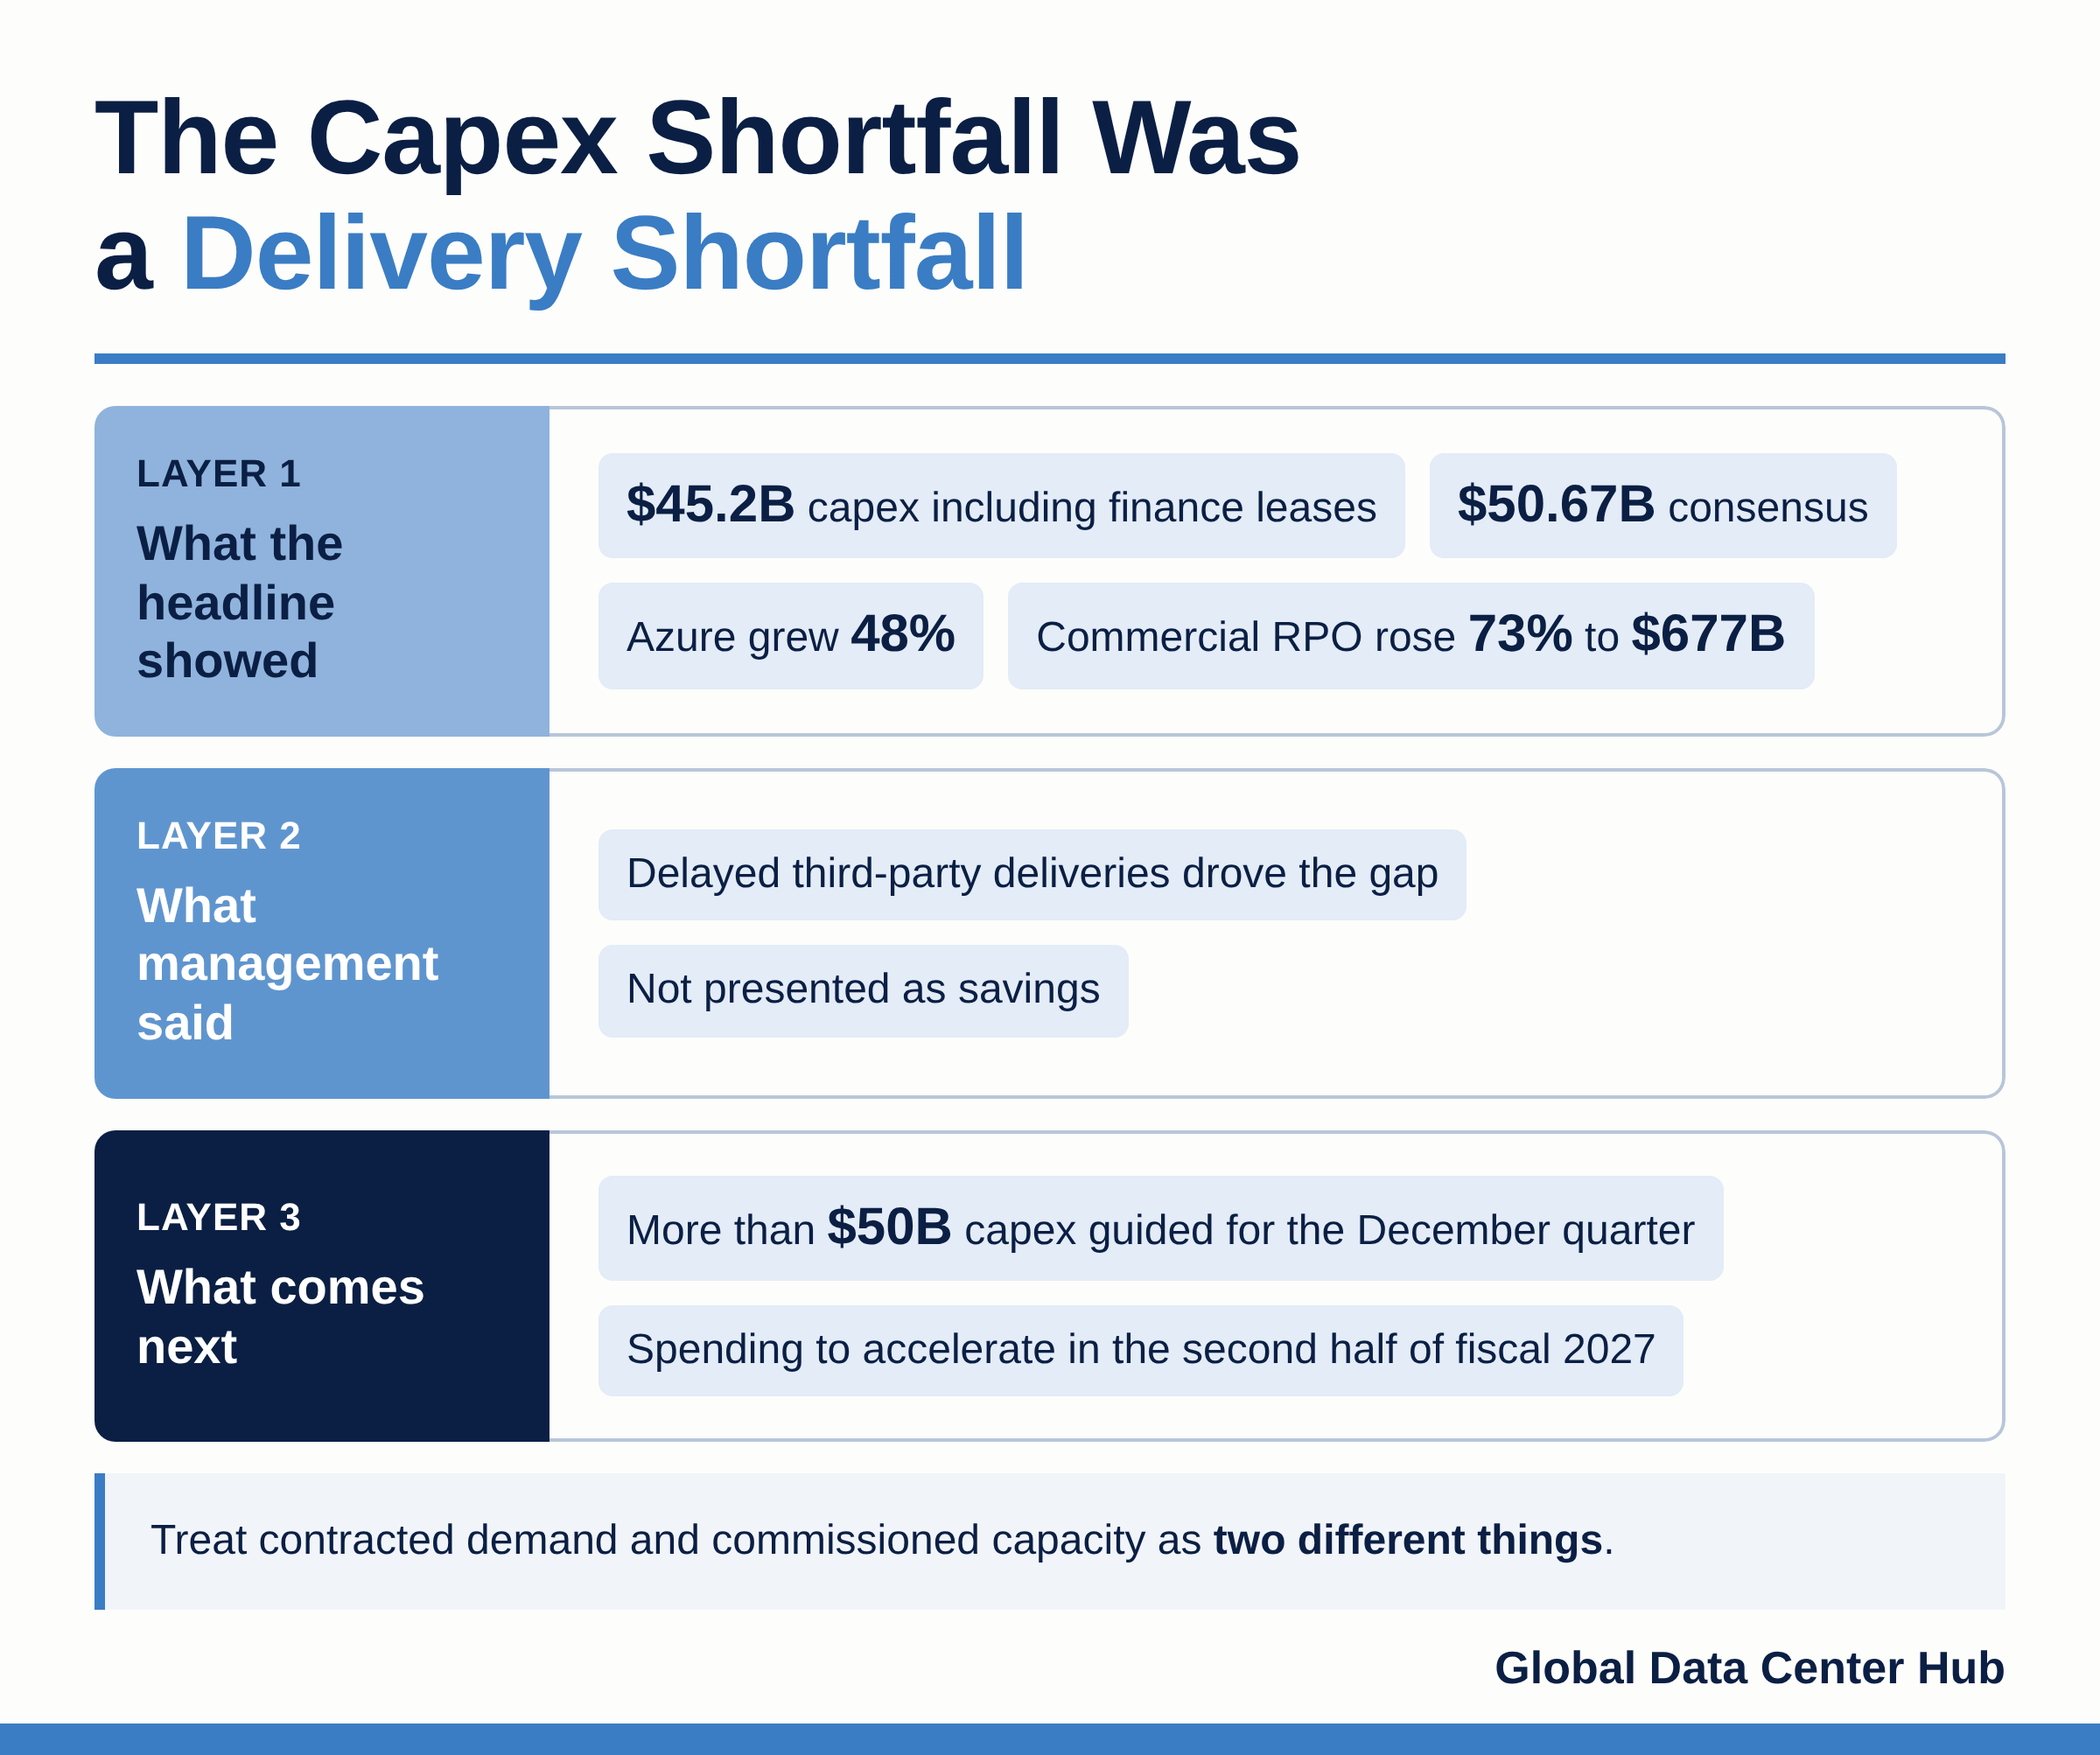
Microsoft reported $45.2B of capex including finance leases, against a $50.67B consensus. Management did not present the gap as savings.
It said delayed third-party deliveries drove it, guided to more than $50B for the December quarter, and said spending would accelerate in the second half of fiscal 2027 as the slipped capacity lands.
On the call, it also referred to about $170B “for the calendar year.”
So, the $5.5B gap is a timing signal, not a demand signal. Commercial bookings fell 12%, but against a prior-year quarter that carried large Azure commitments.
Commercial remaining performance obligations, the contracted backlog, rose 73% to $677B.
What changed is where the constraint showed up. Power remains the long-run limit on new sites, but this quarter the visible bottleneck was handover: equipment that was contracted and expected but not yet delivered, energized, and accepted.
Microsoft’s materials do not name the suppliers or say how many megawatts slipped.
For developers and lenders, the lesson is to treat contracted demand and commissioned capacity as two different things.
Software Turned Into Capacity
The revenue beat came from getting more out of the fleet Microsoft already had.
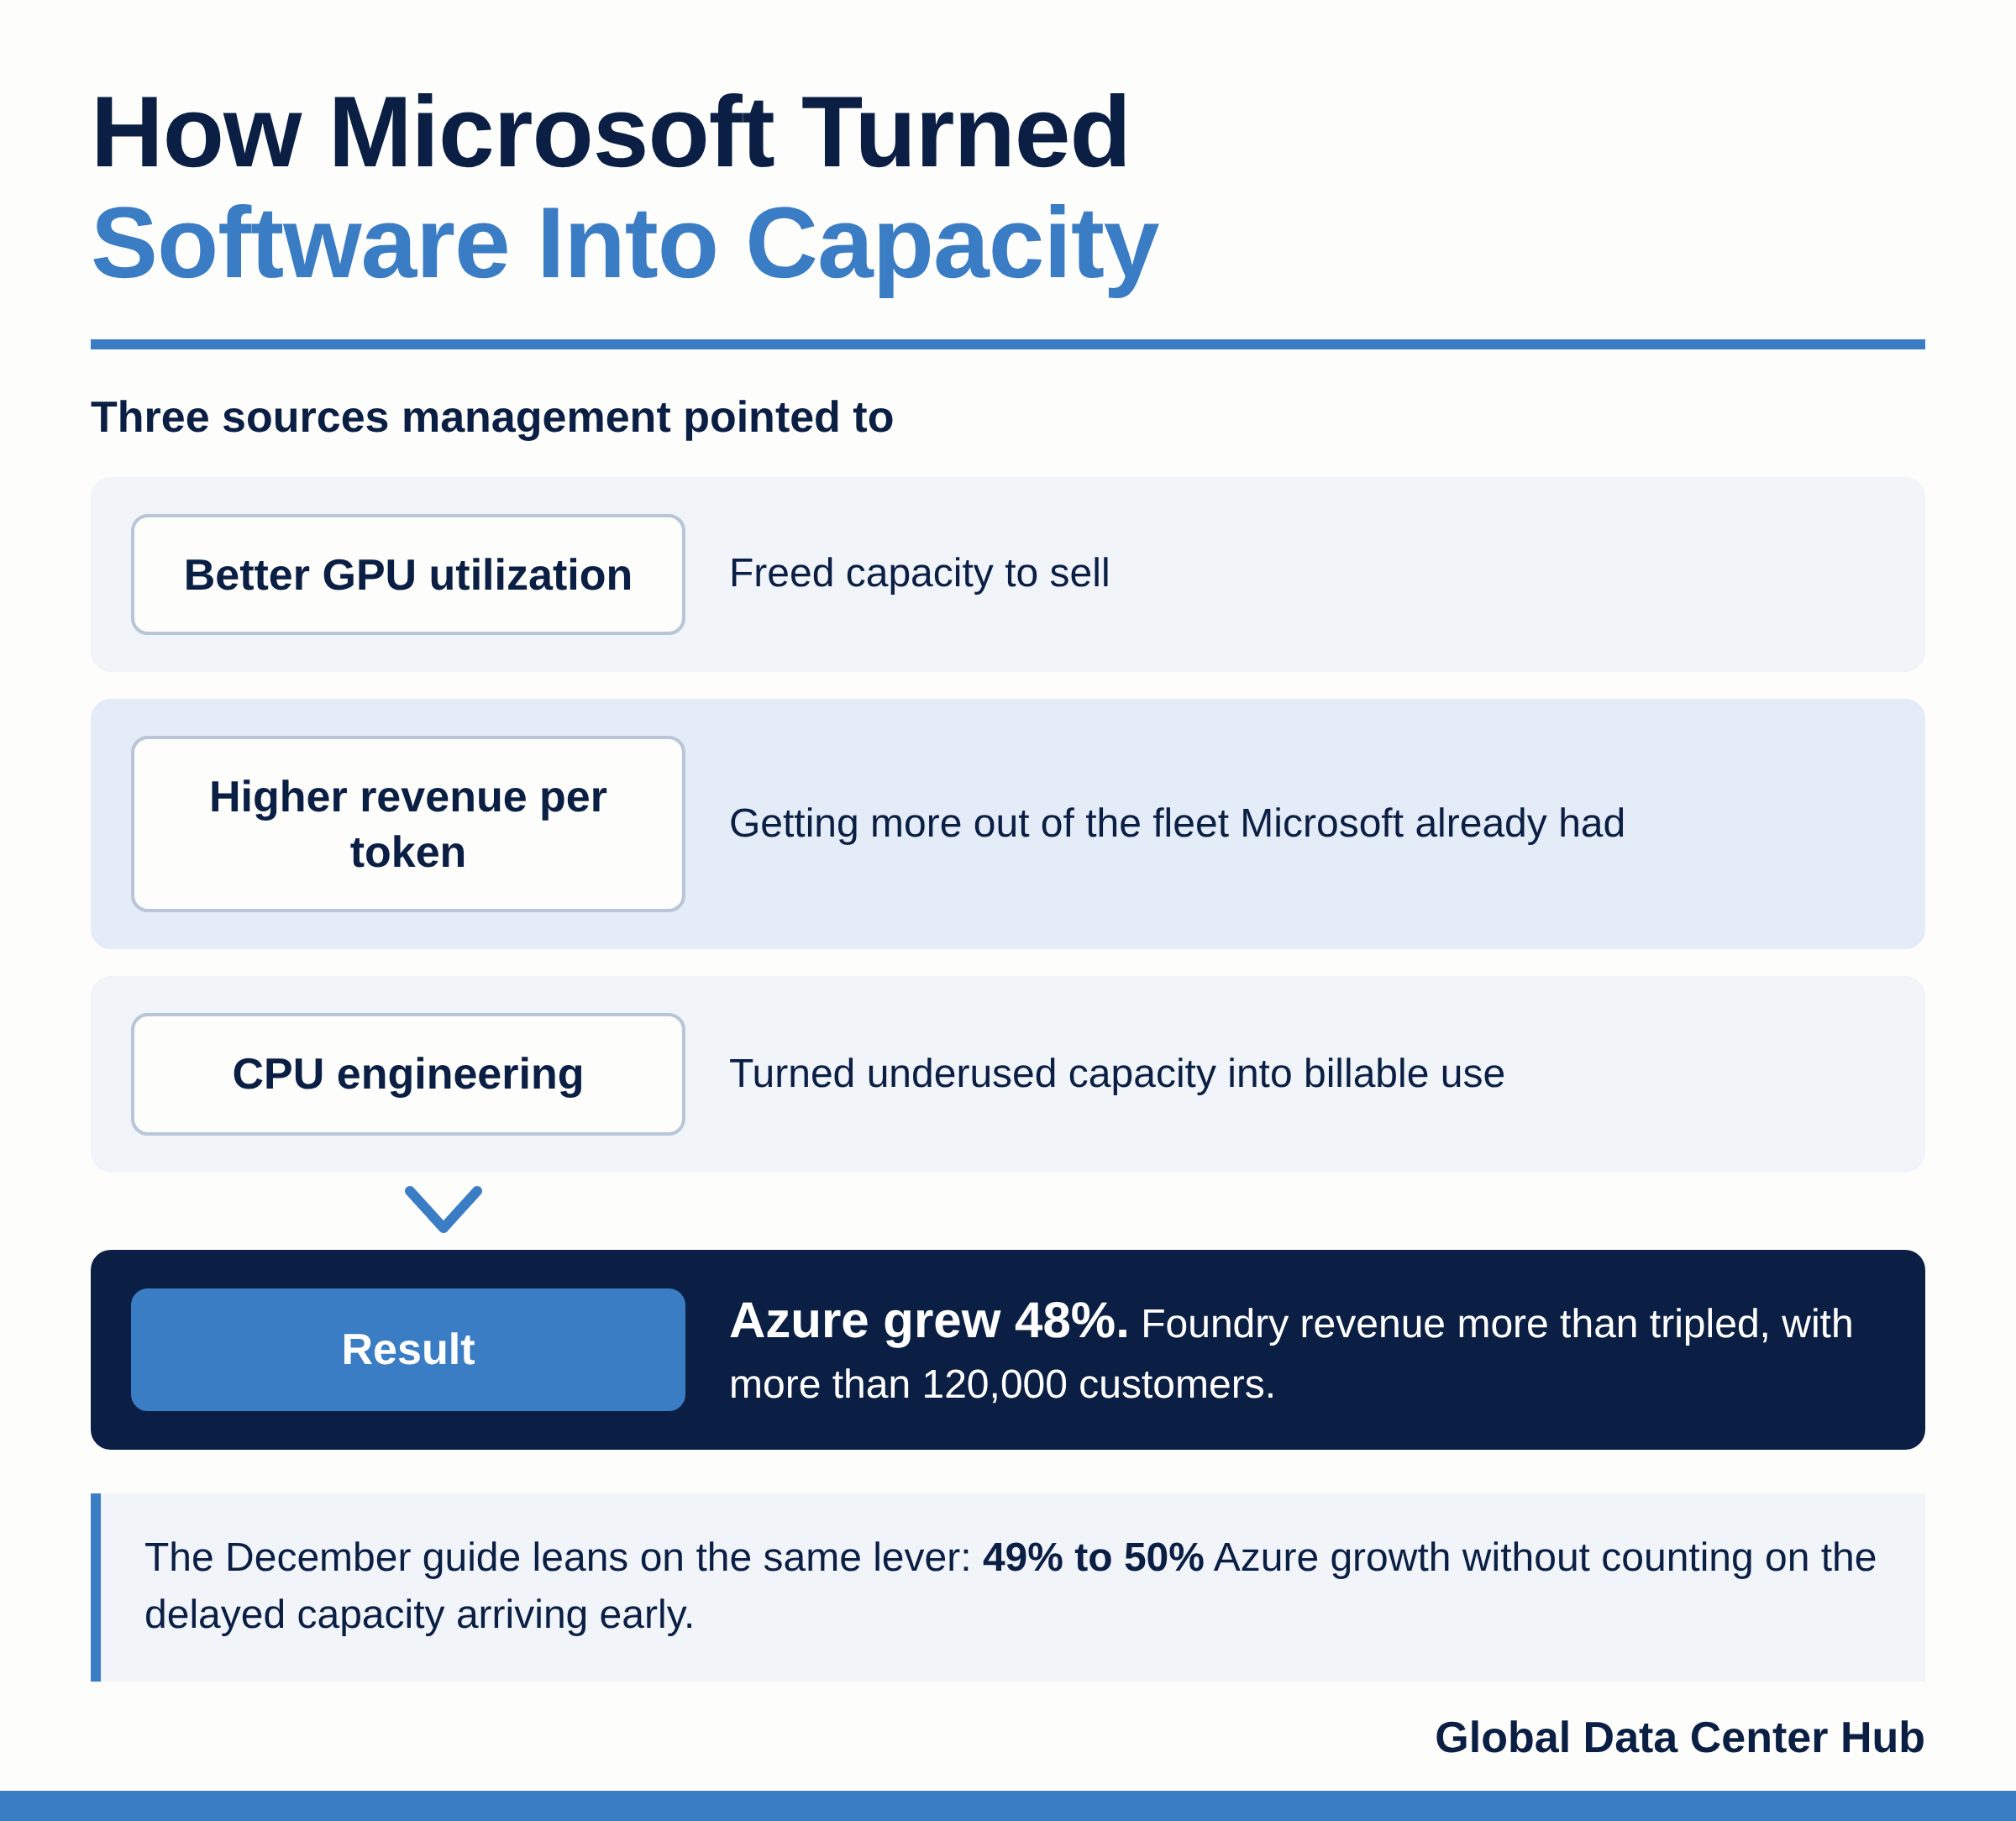
Management pointed to three sources: better GPU utilization, which freed capacity to sell; higher revenue per token; and CPU engineering that turned underused capacity into billable use.
Foundry revenue more than tripled, and Foundry now has more than 120,000 customers.
The physical buildout kept moving too. Microsoft added 24 data centers across five continents.
It cut dock-to-live time for new GB300 systems by about 20% in its largest regions, docked its first NVIDIA Vera Rubin GPUs, and said its own Maia 200 chip delivered up to 1.7 times more tokens per watt in Teams and Copilot.
These are management claims about specific deployments, not fleet-wide benchmarks.
This is the quarter’s most useful finding. Microsoft can now add sellable capacity through software and systems work as well as construction. That is good for returns.
It also breaks the simple link between data center counts, GPU shipments or capex on one side and revenue on the other. Management said as much: efficiencies, third-party deliveries, internal builds and model mix will make quarters uneven.
The December guide leans on that same lever. It does not assume the delayed capacity arrives early.
It assumes further efficiency gains cover the gap, while management flagged uncertainty in token pricing and tougher growth comparisons after the December quarter.
The Capital Footprint Is Wider Than Capex
Operating cash flow rose 28.7% to $58.0B. Cash spent on property and equipment rose 103% to $39.4B. Free cash flow fell 27.4% to $18.6B.
Cash capex absorbed about 67.9% of operating cash flow, up from 43.0% a year earlier, and free cash flow margin fell from about 33.0% to 20.2%.
That is still a lot of cash. The issue is what the headline numbers leave out. Receivables tied to facilitating server-component purchases rose to $35.7B from $27.8B in one quarter.
That is not capex, but it is cash tied up in the supply chain to keep hardware moving.
Operating-lease right-of-use assets rose from $24.2B to $30.2B. About three-quarters of capex went to short-lived assets, mainly CPUs and GPUs, with higher memory and storage costs.
The cost of that equipment is starting to show. The cash flow line for depreciation, amortization, and other rose 44.2% to $11.7B.
Gross margin slipped from 69.05% to 67.79%. Operating margin still rose to 49.76%, because operating expenses grew only 6%.
The income statement is absorbing the buildout well. The cash flow statement shows the load.
Microsoft expects to stay free cash flow positive in fiscal 2027 and said it may use additional funding when attractive.
That keeps options open. It is not an announced debt program, and it should not be read as one.
One Customer, Two Exposures
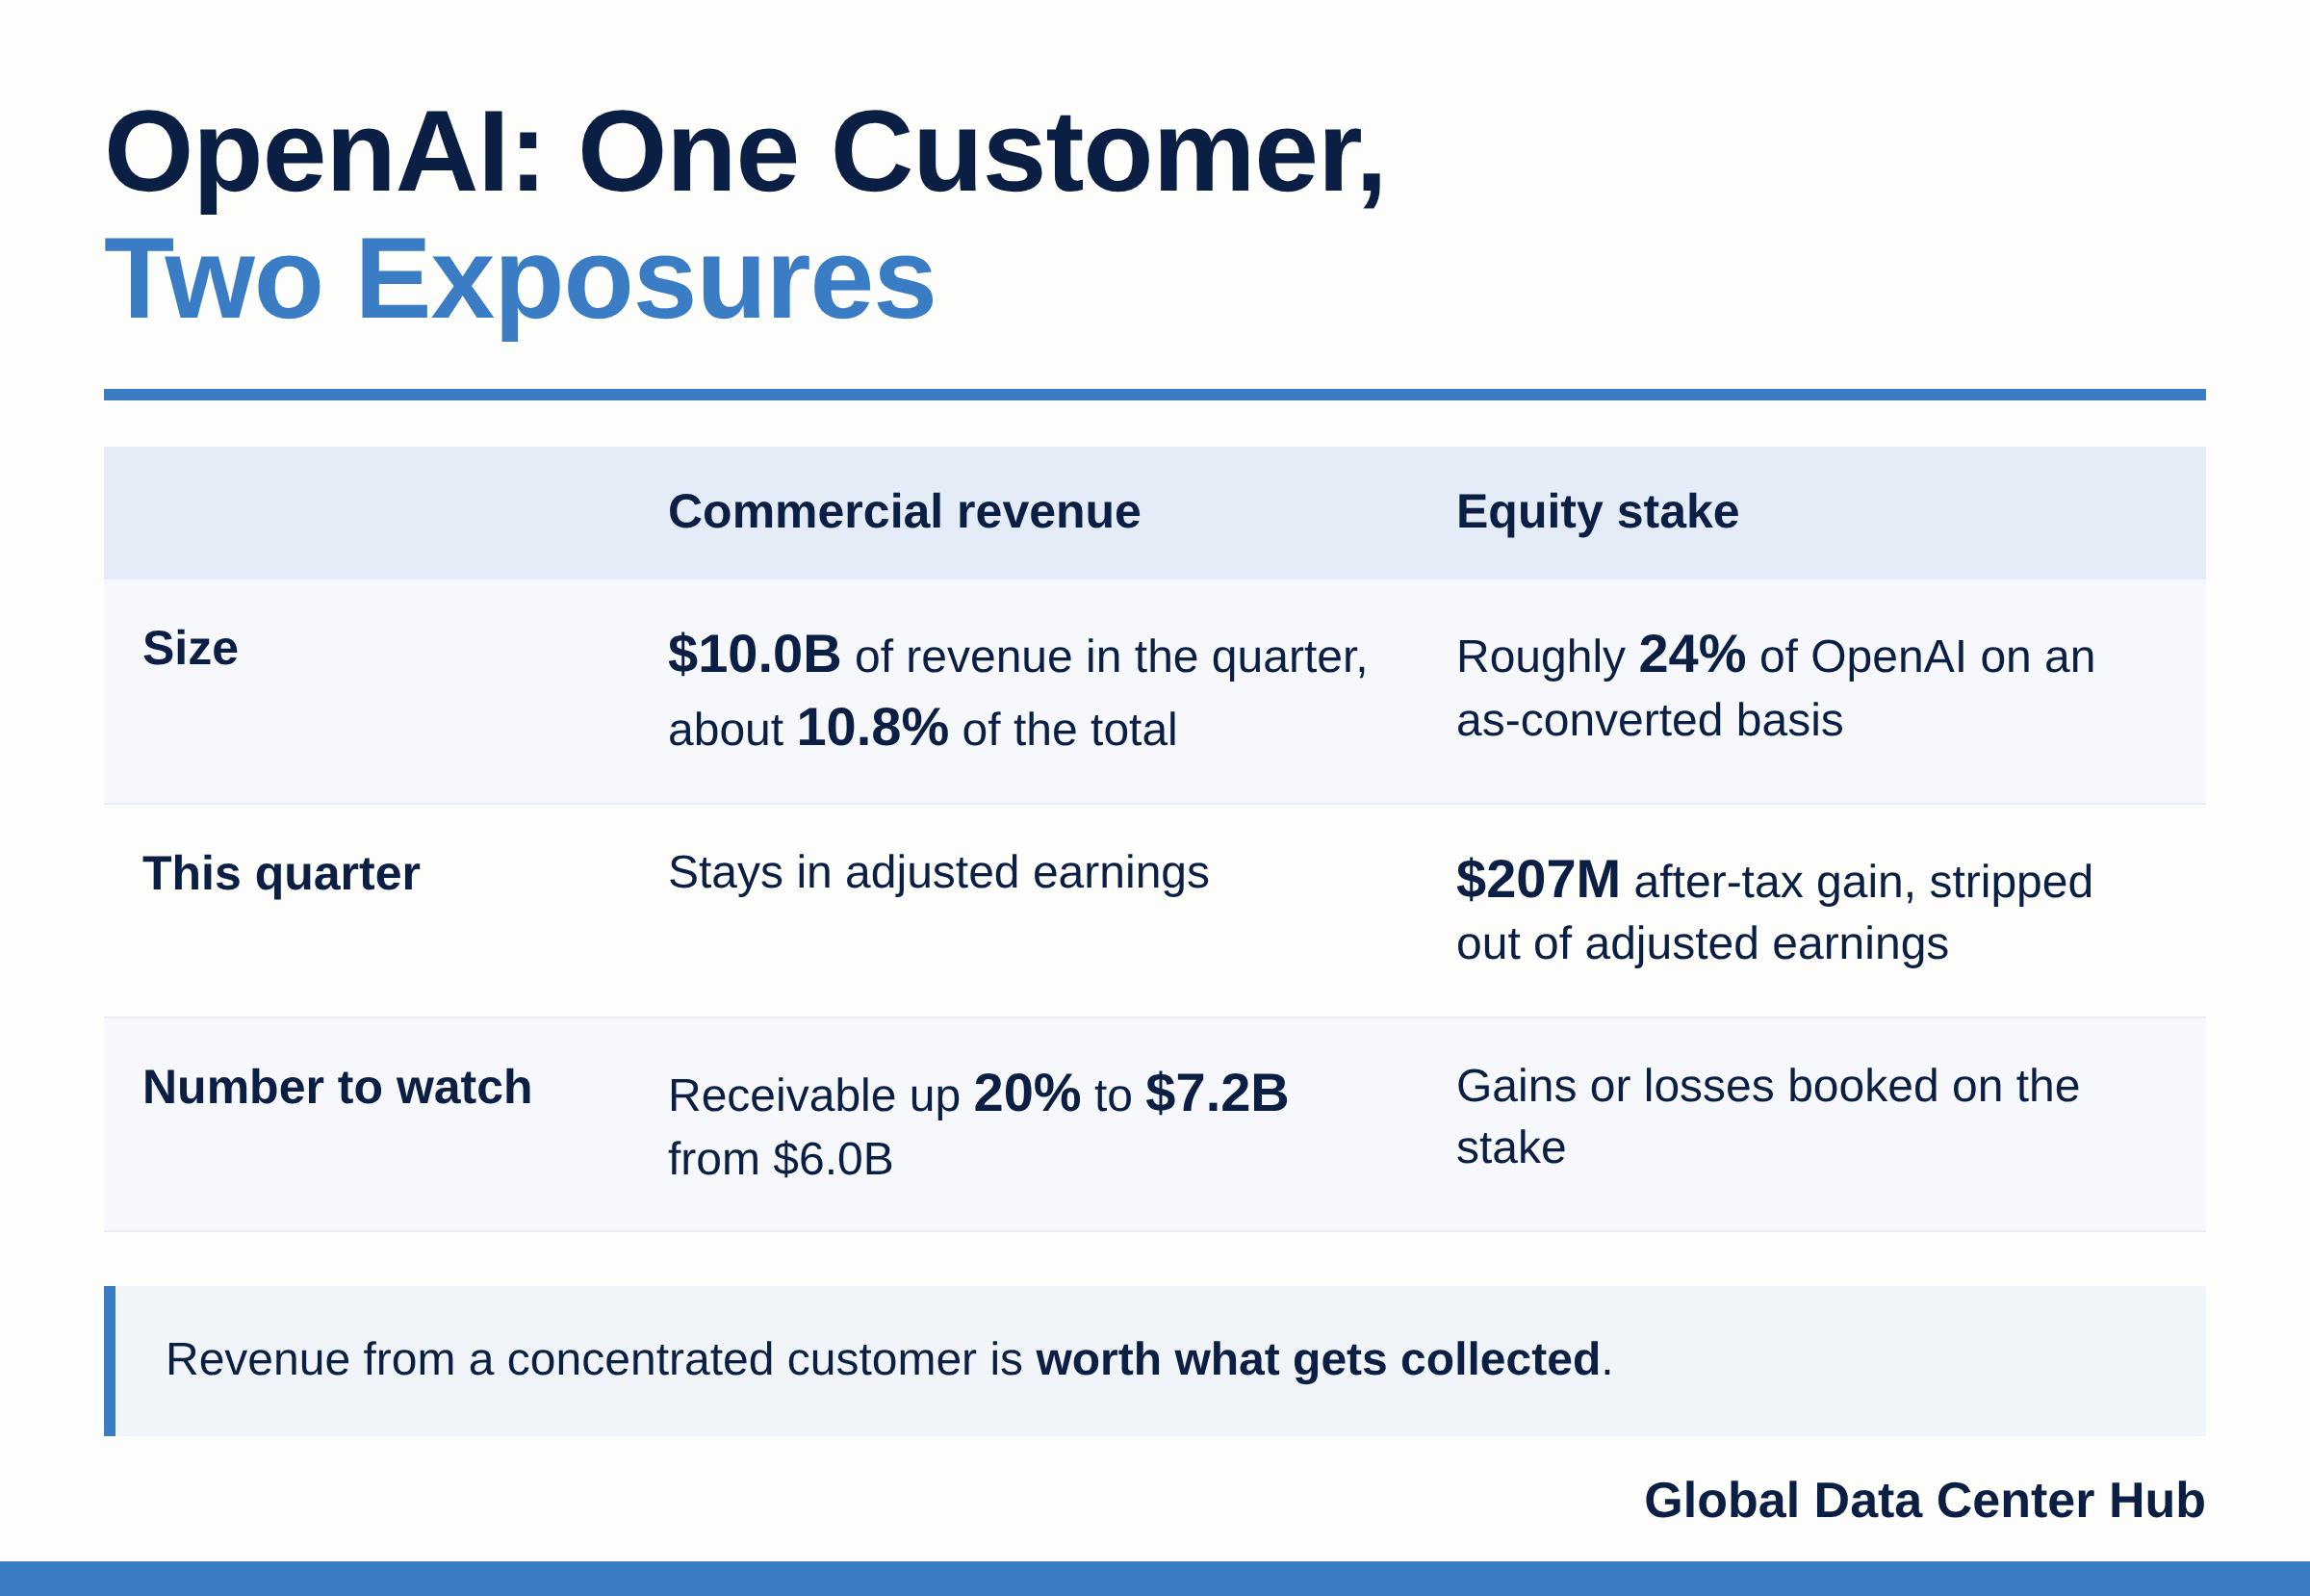
OpenAI produced $10.0B of Microsoft’s revenue in the quarter, about 10.8% of the total. Microsoft also holds roughly 24% of OpenAI on an as-converted basis and books gains or losses on that stake.
This quarter, the stake added a $207M after-tax gain, which adjusted earnings strip out.
The commercial revenue stays in. These are two separate exposures to the same counterparty.
The receivable from OpenAI rose 20% in one quarter, to $7.2B from $6.0B. That is not a warning sign on its own, but it is the number to watch. Revenue from a concentrated customer is worth what gets collected.
The backlog carries a timing twist. Of the $677B in commercial RPO, about 30% is due within 12 months, and that portion grew 29%. The portion due beyond 12 months grew 98%. Weighted-average duration is 2.3 years.
Backlog is growing fastest in the year’s furthest away, while capex is being spent now on equipment that ages quickly. Microsoft did not disclose RPO excluding OpenAI.
Microsoft’s advantage is that it earns from AI at several layers at once: infrastructure, Foundry, data services, and Microsoft 365, where commercial cloud revenue grew 17%. Group operating leverage cushions Azure’s heavier capital needs.
The risk is the other side of the same structure. Azure supplied about 74% of the quarter’s revenue growth, so Microsoft’s returns rest more and more on short-lived equipment and on one large customer.

Delivery, Efficiency and the Wider Capital Stack
Three patterns from this quarter reach beyond Microsoft. First, delivery is now its own constraint.
A company with demand, cash and contracts still fell short of its capex estimate because equipment arrived late.
Anyone financing data center capacity should tie returns to energized, accepted capacity, not signed contracts.
Second, efficiency is now a source of capacity, so capex stops being a clean proxy for growth.
Tokens per watt matter most where power is scarce. If gains like Maia 200’s reported 1.7 times hold up across a fleet, the same grid connection earns more revenue.
Third, the capital stack behind AI is spreading past capex into leases and supply chain working capital. Tracking AI spending through capex alone now undercounts it.
What Resolves Next
Three signals will show whether the quarter’s beat holds. First, December-quarter Azure growth against the 49% to 50% guide, delivered without the delayed capacity.
If Microsoft hits it on efficiency alone, the software-as-a-service case holds. If it falls short, this quarter’s beat rested on a utilization gain that does not repeat.
Second, the arrival of the slipped third-party capacity in the second half of fiscal 2027.
The test is whether it is accepted and billed on schedule, and what capex looks like once it lands.
Third, OpenAI receivables versus OpenAI revenue. If receivables keep growing faster than revenue, concentration becomes a credit question rather than a growth story.