

Welcome to Global Data Center Hub. Join investors, operators, and innovators reading to stay ahead of the latest trends in the data center sector in developed and emerging markets globally.
This article is the 4th article in the series: Ground to Grid: A Free 21-Lesson Guide to Mastering Data Center Development
Market feasibility and demand analysis is the first analytical stage of any data center development.
It determines whether a proposed project sits in a market with real, deliverable demand before capital is committed.
This primer explains how the analysis works in practice, why it differs from traditional real estate feasibility, and why much announced capacity never becomes operating capacity.
What Market Feasibility Means
Market feasibility is the assessment of whether a market can support a proposed project at a scale and price that justify the investment.
In simple terms, it asks whether: (i) demand exists, (ii) that demand can be served at the location, and (iii) the economics work over the life of the asset.
For most asset types the central variable is tenant demand, with supporting infrastructure assumed available.
Data center feasibility reorders the variables: demand is studied, but the limiting factor is rarely demand.
It is the supply of electricity to the site.
Why Data Center Feasibility Differs from Traditional Real Estate Feasibility
A data center is best understood as a power-delivery and compute-hosting facility rather than a conventional building.
Its value depends on bringing large amounts of electricity to a specific point on a specific timeline. Three differences follow.
The first is power intensity.
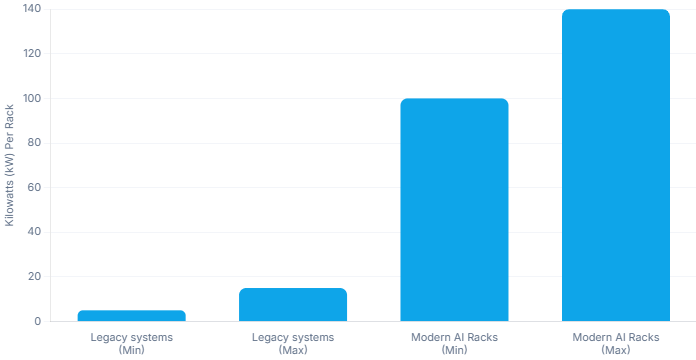
Modern AI racks draw 100 to 140 kilowatts, compared to 5 to 15 kilowatts for older systems. Since a megawatt equals 1,000 kilowatts, large campuses can consume more power than small cities.
As a result, feasibility must assess the full energy supply chain, not just the real estate.
The second is timeline mismatch.
A data center shell can be built in roughly 18 to 24 months, but securing grid power can take four to seven years (or more) in constrained markets.
In traditional real estate, the utility connection is rarely the gating item; in data centers it frequently is.
The third is cost intensity.
Standard hyperscale construction runs roughly $10 to $12 million per megawatt, and AI-optimized facilities can reach $20 million or more.
The capital at risk per megawatt is high, which raises the cost of a feasibility error.
The result is a shift in the central question.
Traditional feasibility asks whether tenants will come; data center feasibility asks whether the site can be powered on the tenant’s schedule.
Reading Demand Signals
Demand analysis begins with the signals that indicate how much capacity the market wants. Three are commonly used.
Announced megawatts are the planned capacity that developers, operators, and utilities publish through press releases, planning applications, and public filings.
This is the broadest and least reliable signal, because an announcement commits no one to build.
Hyperscaler capital expenditure refers to large-scale infrastructure spending by major cloud and AI platforms.
For 2026, total capex across the four largest US hyperscalers is projected at roughly $600–$710 billion, about 75% tied to AI infrastructure, with Amazon alone guiding around $200 billion.
Letters of intent are the third signal.
A letter of intent is a non-binding or partly binding statement that a tenant intends to lease capacity.
It names a counterparty, making it stronger than an announcement, but does not guarantee a signed lease.
Taken together, these signals point to strong, well-funded demand.
For example, North American vacancy is near a record low (~1.4%), and ~92% of under-construction capacity is already committed.
However, none of these metrics alone guarantees that a specific project will ultimately be delivered.
Bankable Demand: What Counts as Real
Bankable demand is demand a lender or investor can rely on when financing a project: the subset of total demand supported by binding, credit-backed commitments.
Separating it from announced demand is the core task of data center feasibility.
Three features raise demand toward bankability.
Pre-leasing is a lease signed before completion, often 24 to 36 months ahead of delivery, which converts a forecast into a contractual obligation.
Credit quality is the tenant’s financial strength; leases to investment-grade hyperscalers support higher leverage.
Contractual commitment covers take-or-pay terms, long durations, and limited termination rights, which make the income stream more reliable.
When these features are present, lenders can extend capital on favorable terms.
Senior debt can reach up to 80-90 percent of project cost, but typically only where demand is contractually secured and power is confirmed.
A pre-lease without confirmed power remains exposed to the largest delivery risk in the sector.
Power Deliverability: The Binding Constraint
Power deliverability is the assessment of whether electricity can reach the site in the quantity and on the timeline the project requires.
It is the variable that most often separates feasible projects from infeasible ones.
The starting point is the interconnection queue, the waiting list a project joins to connect a new load or generator to the grid. Federal guidelines target 8 to 11 months, but actual averages are longer.
The US national average is around 25 months. PJM, covering much of the eastern United States, averages about 40 months; ERCOT, the Texas grid, averages about 20. In the zones where data centers concentrate, waits of 36 to 48 months are common.
Completion rates compound the delay. Of projects that entered the ERCOT queue by 2020, about 40 percent reached an interconnection agreement or operation; in PJM the figure was about 24 percent. Most applications are withdrawn.
Grid constraints are often physical, not financial. In Northern Virginia, the utility cannot guarantee power for new data centers due to transmission limits, even when generation exists.
Local zoning rules, such as Loudoun County’s special exception requirement, further restrict development.
Because grid connections are slow, the industry is shifting to alternatives. About 30% of planned US capacity now uses behind-the-meter generation. For example, Meta’s $1.6B gas turbine deal for its Ohio campus helped drive a 27% rise in turbine orders in 2025.
A Simple Conversion Model: From Announced Demand to Energized Capacity
Demand analysis can be organized as a funnel with four stages, each narrower and more reliable than the one before.
Announced demand is capacity stated through press releases, planning applications, and letters of intent. It is the largest figure and the least certain; historically, 60 to 76 percent is never built.
Pre-leased demand is capacity covered by a signed lease, often on a building already under construction. It filters out speculative announcements but remains exposed to power-delivery risk.
Power-backed demand is pre-leased capacity that also holds a confirmed power arrangement, such as an executed interconnection agreement, a power purchase agreement, or a utility will-serve letter.
This is the bankable stage, where the main remaining risk is construction.
Energized capacity is capacity with power delivered and the facility operating, where lease income has commenced. This is the only fully de-risked stage.
The gap between the first and last stage is large. Applying the historical conversion rate of 24 to 40 percent to North America’s planned pipeline of about 31.6 gigawatts implies that roughly 7.6 to 12.6 gigawatts may reach operation by 2030.
The deliverable figure is a fraction of the announced figure, and a sound study reports it as the basis for decisions.
Practical Implications
For developers, the lesson is to secure the power path early. A project without a credible route to power carries the highest risk in the development cycle.
Controlling transmission-adjacent sites, advancing interconnection applications, and arranging on-site generation where appropriate move a project toward bankability.
For investors, the lesson is to underwrite demand by stage rather than by headline. A pipeline figure should be discounted to its power-backed and energized components before it informs a valuation.
Confirmed power, tenant credit, and contractual terms determine whether projected income is reliable.
For site selection, power availability is now the primary factor, ahead of land cost and often fiber. Markets with faster interconnection, available transmission capacity, and supportive zoning have a clear advantage, shifting development toward secondary markets and sites with on-site or dedicated generation.
Market feasibility and demand analysis ultimately produces a single output: an estimate of demand that can be reliably powered and delivered at a given site, within a defined timeline and cost. That estimate underpins every later stage of development.
Part 5 examines how billion-dollar sites get bought and the diligence that kills bad deals: Land Is No Longer the First Question in Data Center Development