

Welcome to Global Data Center Hub. Join investors, operators, and innovators reading to stay ahead of the latest trends in the data center sector in developed and emerging markets globally.
This article is the 9th article in the series: Ground to Grid: A Free 21-Lesson Guide to Mastering Data Center Development
TL;DR
Rack density has separated into two curves, with fleet-wide averages between 8 kW and 27 kW per rack and AI and HPC cabinets between 40 kW and 142 kW. Air cooling reaches a physical limit near 41 kW per rack, above which direct-to-chip liquid becomes the only viable path. A capacity plan calibrated on a single blended density figure is calibrated against a facility that does not exist.
Redundancy in a data center is specified as N, N+1, or 2N, and the cost of 2N scales with every megawatt rather than sitting as a fixed premium. N provides no spare capacity, N+1 adds one backup component, while 2N duplicates critical components across two independent distribution paths. Redundancy topology and Uptime Institute Tier classification are distinct: Tier evaluates overall facility capability, not component counts alone.
High-voltage substation transformers carry lead times of 36 to 48 months and medium-voltage switchgear runs 20 to 30 months, against a lease cycle that runs roughly 18 months from signature to required energization. Mechanical and IT infrastructure can be deployed in 5 MW to 10 MW blocks as leases are signed. The electrical backbone has to be committed before that demand is visible, which is the boundary the phasing decision runs into.
Capacity planning is the discipline of building for demand you cannot yet see.
Build too little and you cap your growth. Build too much and you strand capital in empty halls. The whole skill is calibrating the gap.
This is the quantitative core of the design stage.
Everything before it describes what a market might absorb.
Capacity planning converts that description into engineered megawatts, cooling capacity, and floor area.
Three decisions carry the work. They are usually taught as three separate exercises.
They resolve as one, because each decision moves the other two.
Get the calibration wrong and the cost appears in one of two forms: tenants you cannot serve, or capital sitting in space that earns nothing.
The Three Variables
IT load. This is the compute the facility must power and cool, measured in megawatts.
It is set by the tenant and the workload type, and it anchors every other system in the build.
Two related numbers sit above it. Facility load adds cooling plant, UPS conversion losses, distribution losses, lighting, and security.
Utility load is the gross capacity reserved at the substation, which includes facility load plus transformer losses and utility engineering margin.
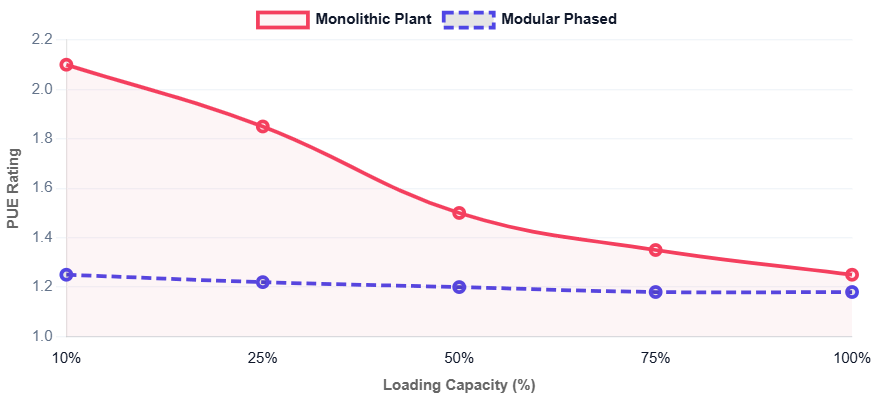
Power Usage Effectiveness is facility load divided by IT load.
PUE changes with utilization because fixed overhead remains even when compute load falls.
One source estimate day-one PUE at 1.85–2.10 for a 40 MW plant carrying 10 MW initially, versus 1.18–1.25 for a modular plant at the same load; these figures are document-sourced and independently unverified.
Density is where IT load becomes a design constraint, not just a number. Average rack density ranges from 8–27 kW, while AI/HPC racks can reach 40–142 kW.
Air cooling approaches its practical limit around 41 kW per rack, making direct-to-chip liquid cooling increasingly necessary at higher densities.
Redundancy. This is how much backup the design carries.
N carries no spare capacity, so any failure or maintenance event sheds load.
N+1 adds one component beyond base capacity. 2N duplicates every critical component across two independent distribution paths, either of which can carry the full design load.
More redundancy buys more reliability and costs more per megawatt.
The level chosen is a commercial decision as much as a technical one, because it is set by what the tenant will pay for and contractually require.
Scalability. This is the path to add capacity in phases as demand arrives.
The design objective is that expansion does not require rebuilding what already exists.
The standard approach separates the building from its equipment: developers build a powered shell for long-term capacity, then deploy 5–10 MW blocks as leases are signed.
This works only if the shell is designed for future loads, with floor slabs above 350 psf and clear heights over 24 feet to support liquid-cooled racks without structural retrofits.
How the Three Interact
Higher IT density raises cooling and power requirements across the whole build, not only in the hall where the dense racks sit.
The distribution topology, the plant sizing, and the structural loading all move with it.
Higher redundancy multiplies the cost of every megawatt. A 2N design does not add a fixed premium.
It scales with capacity, so the redundancy decision compounds as the facility grows.
A scalable design front-loads some cost to avoid a larger cost later.
Oversized fluid headers installed during shell construction cost under 1 percent of total project capital.
Retrofitting the same pipework into an occupied hall costs $2.0 million to $3.0 million per MW.
The tenant type sets the acceptable trade-off among all three.
An AI training tenant will accept lower redundancy in exchange for maximum power and density, because the software layer handles fault recovery.
A multi-tenant colocation operator cannot make that trade, because the reliability commitment is contractual and uniform across the hall.
Where Capacity Planning Fails
Designing for peak demand that never materializes.
The plant is sized for an end state that absorption never reaches, and the capital sits idle while the equipment depreciates.
Under-provisioning redundancy for a tenant that requires 2N. The facility is complete and cannot serve the lease it was built to win.
Building a facility that cannot phase forces full upfront commitment, and long equipment lead times make late additions difficult.
High-voltage transformers can take 36–48 months, while medium-voltage switchgear may require 20–30 months. If the electrical backbone is ordered only after a tenant signs, energization may miss the planned timeline.
Locking density assumptions that the workload later exceeds. A hall engineered for 8 kW per rack exhausts its power and cooling capacity while a large share of the floor sits empty, and the retrofit to liquid arrives at brownfield cost.
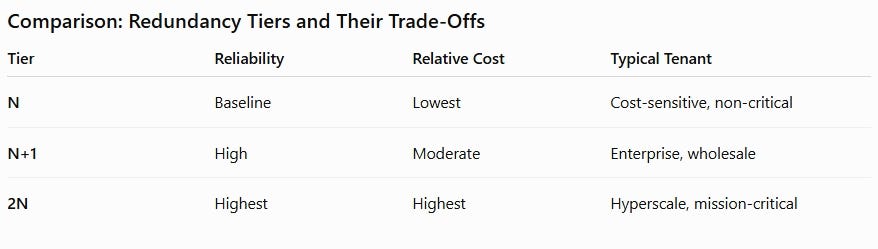
One distinction matters when reading these levels against a certification claim.
Redundancy describes component counts and pathway layouts.
Uptime Institute Tier classification measures operational capability across the whole facility, including distribution path count and concurrent maintainability, so the two are separate measures rather than one scale.
Strategic Implications
For developers. Phase your capacity to demand. The empty hall you built too early is capital earning nothing.
Separate what phases from what does not, because the components with multi-year lead times have to be committed on a different schedule than the mechanical plant.
For investors. Understand what the capacity plan assumes about absorption.
Overbuilt redundancy and stranded phases both erode returns, and they erode them through different mechanisms.
Overbuilt redundancy raises cost per megawatt permanently. Stranded phases delay revenue against capital already spent.
For operators. The redundancy level and density ceiling set at this stage define your reliability commitments and your headroom.
Both are difficult to change once the hall is occupied.
For policymakers. Capacity decisions drive the power load your grid must serve.
The density trend is raising it fast, and the fleet-wide average understates the pace because high-density deployments sit far above it.
Key Takeaway
Capacity planning is not about building the biggest facility.
It is about building exactly enough, phased to arrive as the demand does. The waste is on both sides of that line.
The calibration question is where each subsequent stage of the development process begins.
The financing structure, the construction sequence, and the operating cost base all inherit the numbers set here.
When you plan capacity, do you err toward overbuilding for growth or phasing tightly to demand, and what has that choice cost or saved you?
Part 10 examines how cooling, power, and network design fit together: How Cooling, Power, and Network Design Actually Fit Together